Two official updates provide a focused way to examine how satellites can affect both astronomical observations and environmental measurement. The European Southern Observatory’s press release, dated 1 July 2026, discusses proposals to place more than 1.7 million satellites in orbit. The World Health Organization’s update, dated 29 June 2026, reports on global PM2.5 exposure and explains how satellite observations contribute to the monitoring method.
This guide is designed to keep those findings in their proper categories. The ESO material is an assessment of proposed satellite populations, supported by simulations and calculations. The WHO material is a reporting update about an air-pollution indicator and the data product used to measure it. Reading them accurately means preserving that distinction and checking each number against the statement that produced it.
1. Start with the source and date
Begin by opening the official ESO page and recording the date shown in the dossier: 1 July 2026. Then record the date on the WHO update: 29 June 2026. These dates are part of the evidence, not decoration. They identify the particular updates being summarized and help prevent a figure from one announcement being presented as if it came from the other.
Next, keep the source roles separate. ESO is the source for the satellite-constellation proposals, the estimated consequences for astronomy, the VLT simulation, and the calculations concerning Reflect Orbital’s planned constellation. WHO is the source for the PM2.5 figures and for the description of the satellite-based monitoring product. Do not use the WHO update to support an ESO number, or the ESO release to support a WHO health indicator.
2. Separate proposals from simulations
The ESO study concerns proposals that would put more than 1.7 million satellites into orbit. The release says ESO considers the consequences for astronomy potentially devastating. Those statements describe the scale and the assessment attached to the proposals. They do not, by themselves, say that every proposed satellite has already been launched or that the projected effects have been observed in one single image.
A useful verification habit is to label every sentence according to its status: proposal, estimate, simulation, or reported calculation. In this case, the proposed total belongs to the first category. The assessment of consequences is ESO’s stated conclusion. The VLT result belongs to the simulation category. That wording matters because a simulation is evidence about a modeled scenario, while an observation would describe an image that was actually recorded under specified conditions.
3. Check what the VLT simulation actually measures
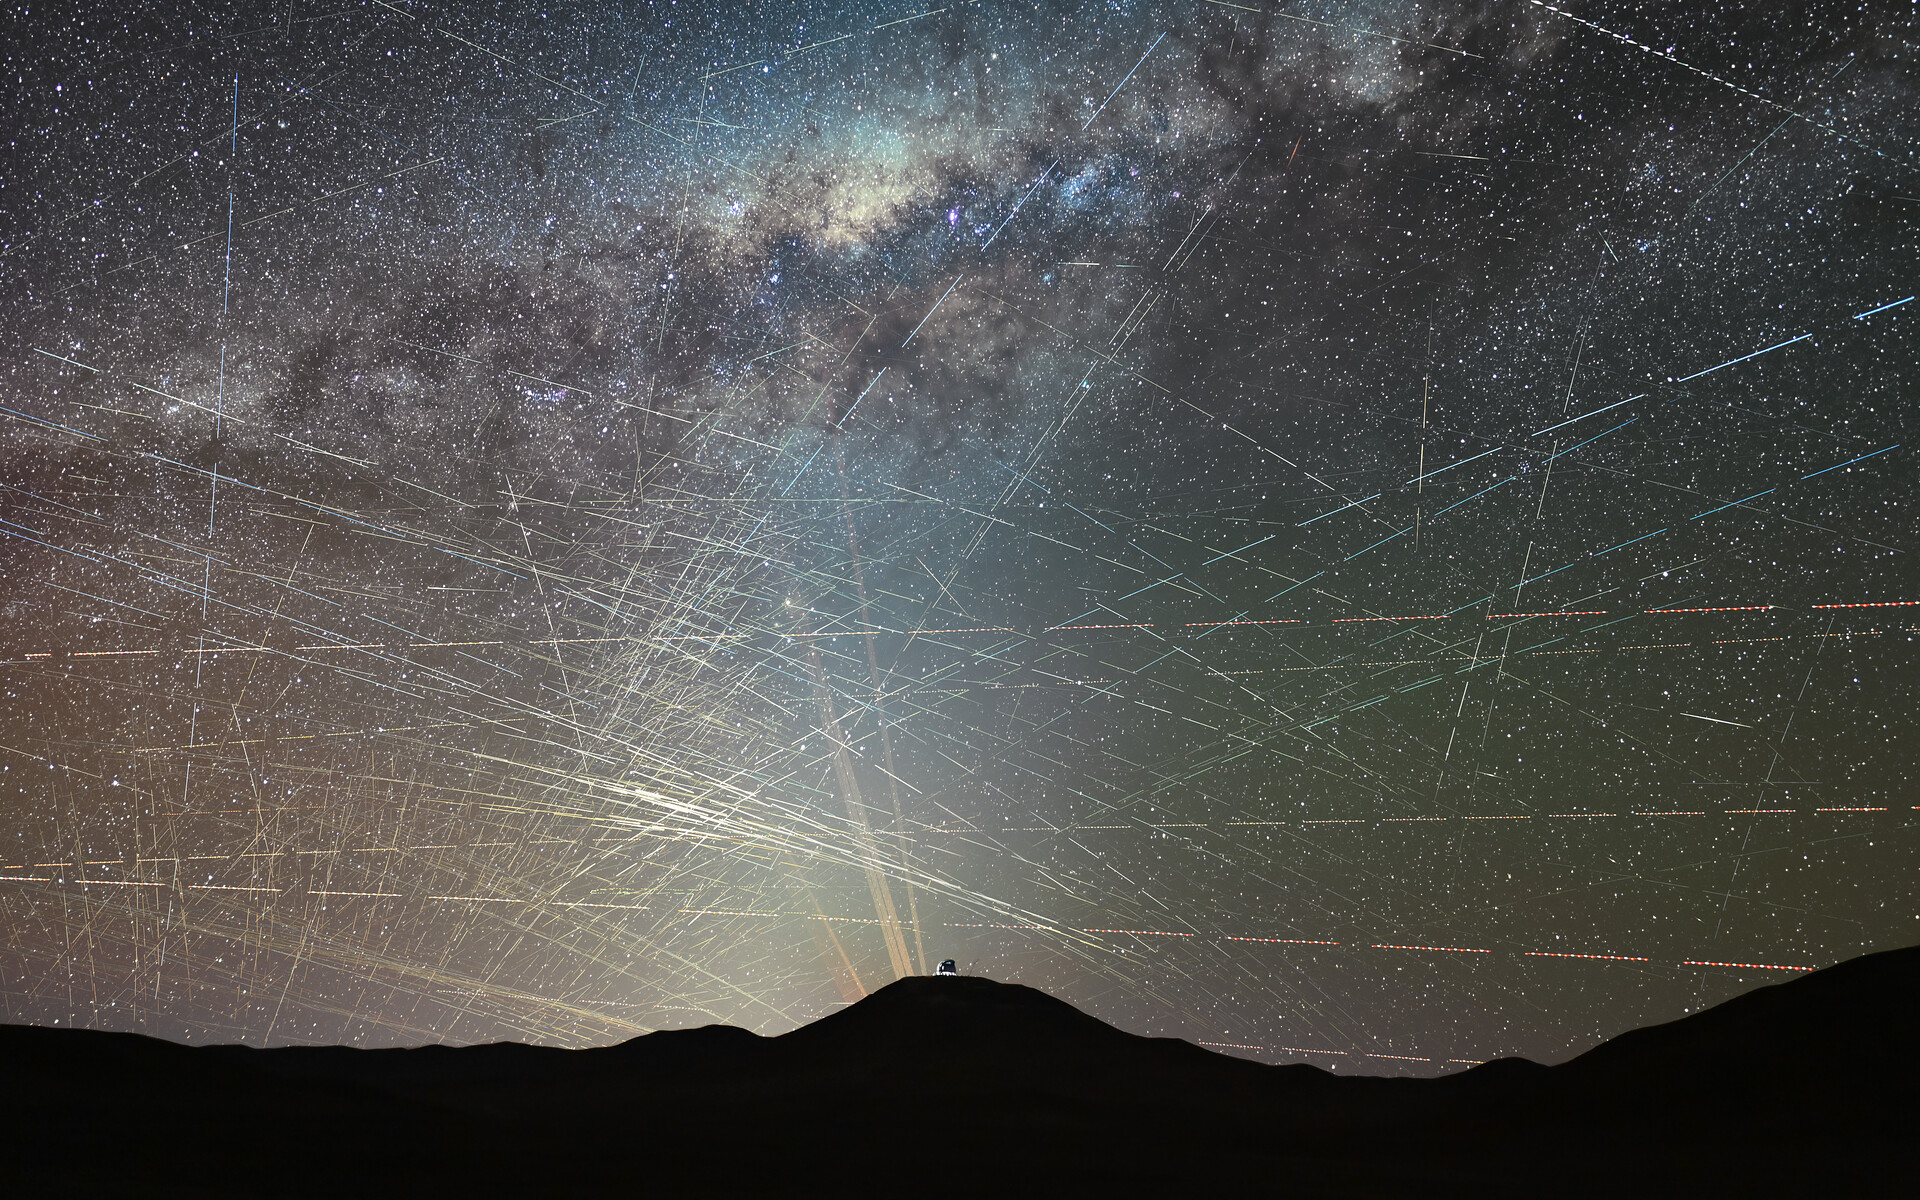
For SpaceX’s megaconstellation, ESO’s simulation predicts dozens of trails in every image taken two hours after the beginning of the night with the Very Large Telescope. The same simulation estimates that the loss of field could reach 28 percent.
To report this accurately, preserve all of the conditions attached to the result: the constellation scenario, the VLT, the two-hour point after the start of night, the appearance of dozens of trails, and the possible field loss of up to 28 percent. Avoid shortening the claim to “28 percent of astronomy will be lost.” The dossier supports a possible loss of field in the stated simulation, not a universal measure of all astronomical work.
4. Treat the Reflect Orbital calculation as a separate scenario
ESO also reports that Reflect Orbital plans to increase its mirror-satellite constellation to 50,000 units by 2035. ESO calculates that, with those 50,000 satellites, the overall brightness of the sky could become three or four times greater.
This is a second scenario and should remain visibly separate from the SpaceX VLT simulation. The two figures answer different questions: one describes predicted trails and possible field loss in VLT images; the other describes a calculated change in overall sky brightness under a 50,000-satellite scenario. Combining them into one percentage or presenting either number as a measurement of the other would change the evidence.
5. Read the air-quality claims with the same care
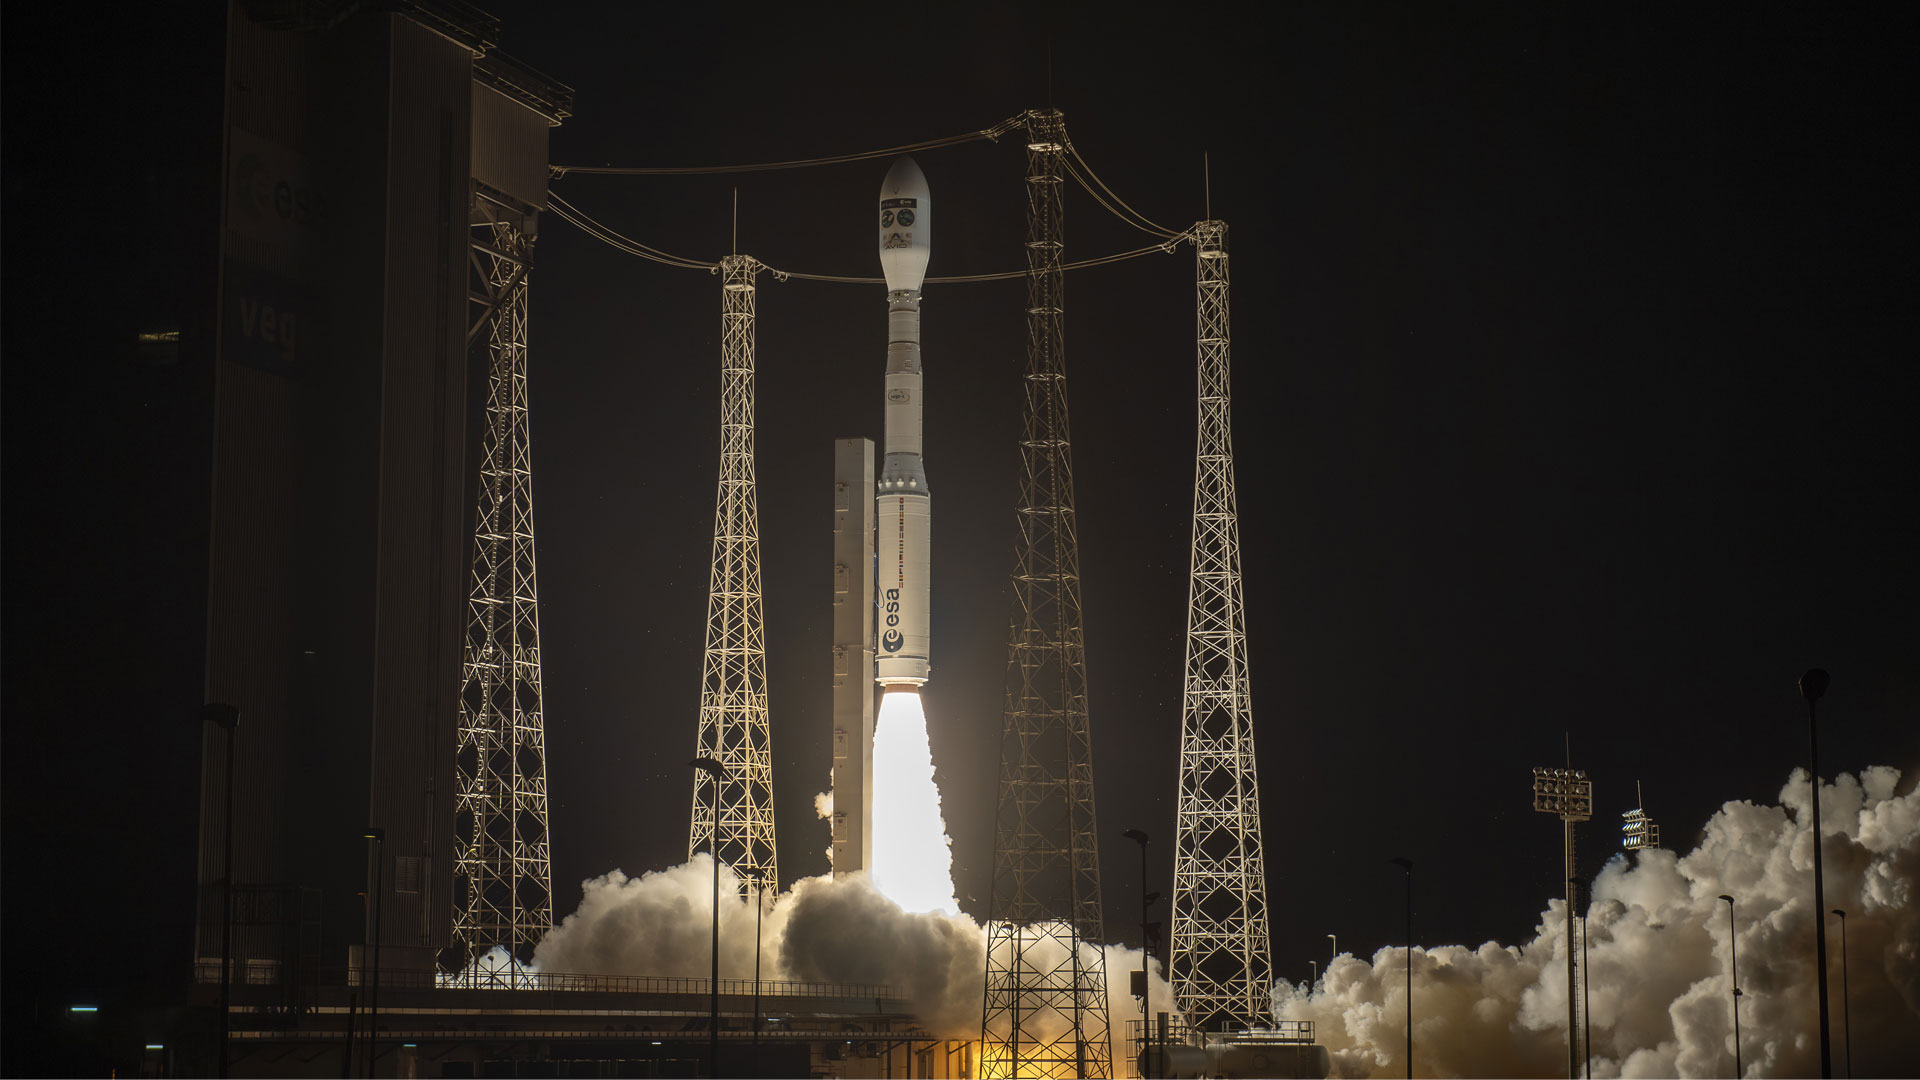
ESO states that large constellations have direct impacts on air quality because of the launches required and atmospheric pollution during re-entries. The WHO update supplies a separate measurement context: global PM2.5 concentrations declined until 2020 and then remained largely unchanged. WHO reports that, in 2023, 6.5 billion people were exposed to PM2.5 concentrations above 35 µg/m³.
The safe way to connect these facts is to identify them as separate official findings. ESO discusses the air-quality implications associated with launches and re-entries. WHO reports the worldwide PM2.5 situation and the population exposed above its stated concentration threshold. The dossier does not establish that the ESO scenarios caused the WHO figure, so that causal claim should not be added.
6. Verify how WHO builds its indicator
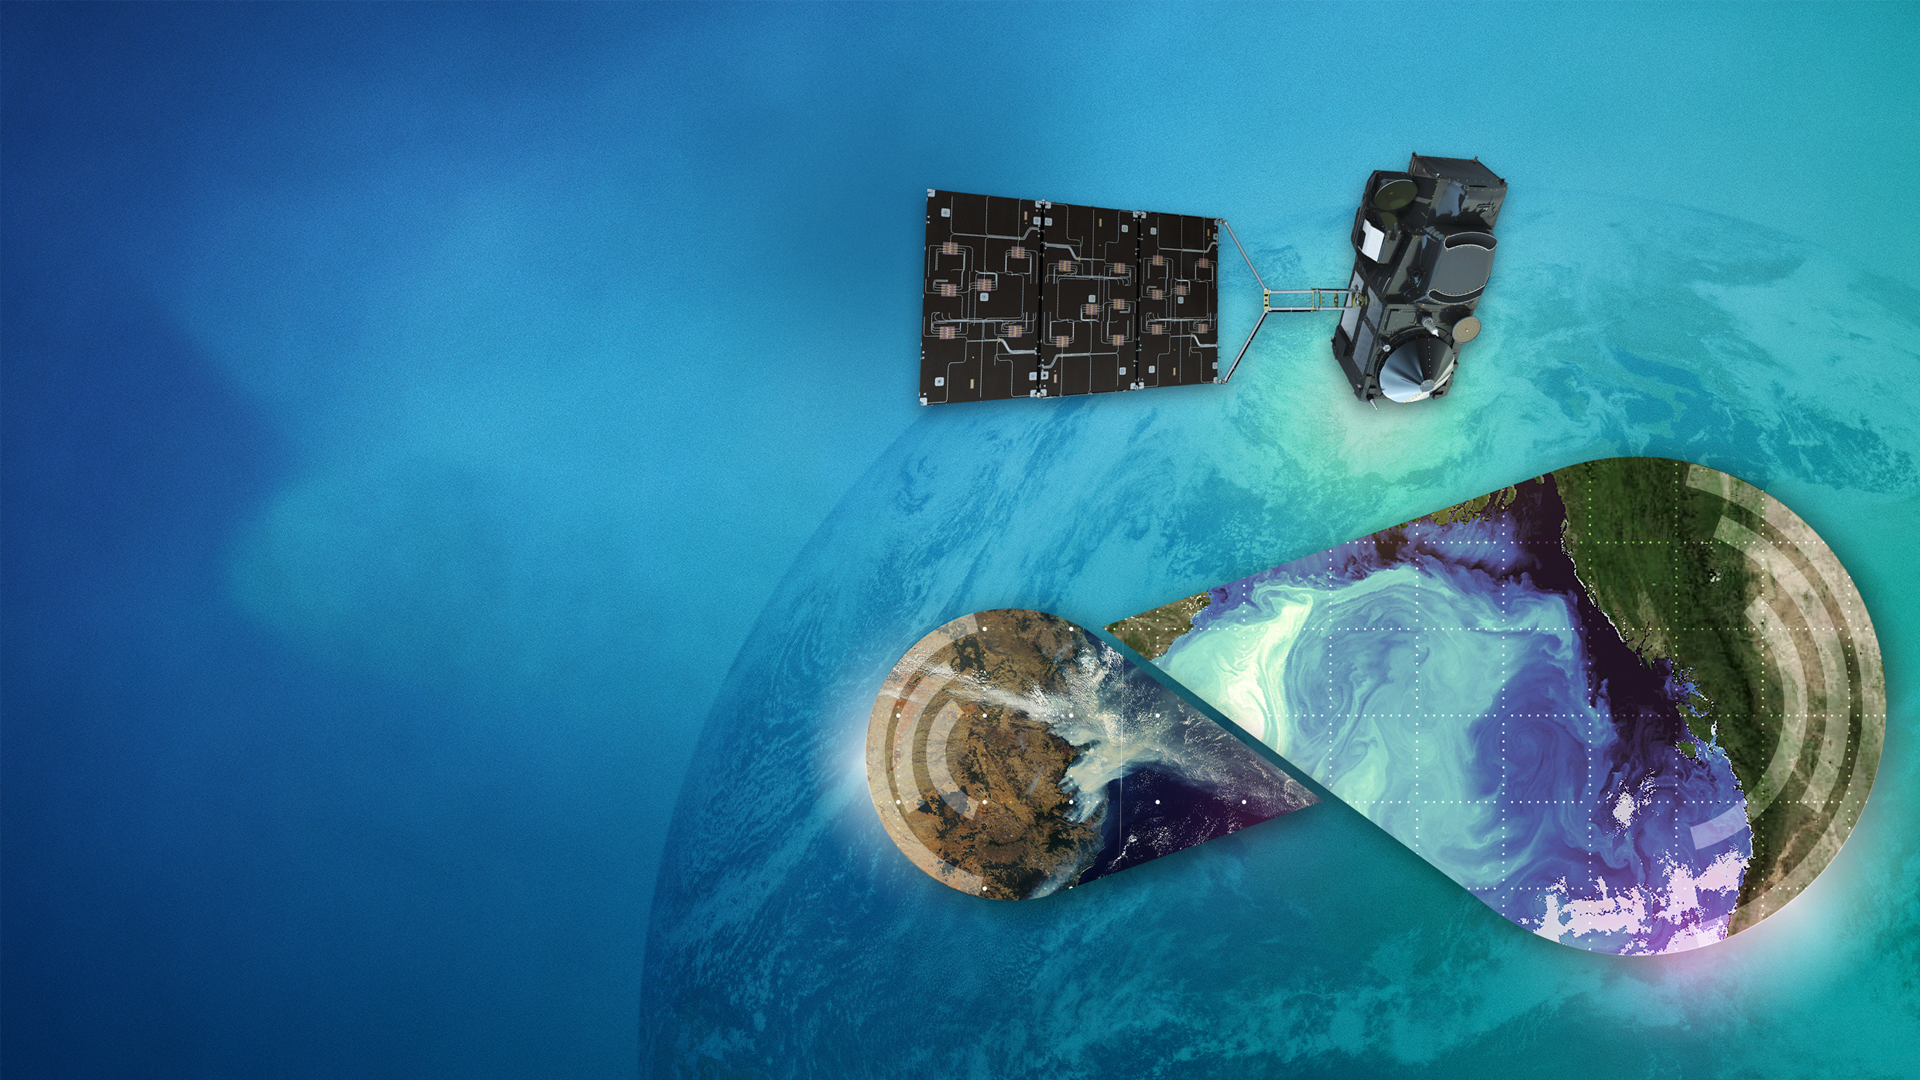
WHO says the SDG 11.6.2 indicator uses a satellite product that combines several observations with atmospheric models. It also says the product is recalibrated using national air-quality monitoring data and population data.
That description provides a final verification check. When summarizing the indicator, include both parts of the method: the combination of satellite observations and atmospheric models, and the recalibration with national monitoring and population data. Calling it simply “satellite tracking” would omit information WHO considers part of the measurement process.
The clearest report therefore keeps four boundaries intact: ESO’s date and proposed satellite scale; the conditions and limits of its VLT simulation; the separate Reflect Orbital sky-brightness calculation; and WHO’s dated PM2.5 update with its stated measurement method. Those boundaries make the evidence easier to verify and prevent a technical assessment from becoming a broader claim than the sources support.